Buying ETFs at 52 Week Lows
Check out my list of ETFs trading at 52 week lows here. 52 week lows are also marked on the stock charts of all of the ETFs listed on this site.
I haven't seem many private investors talking about the strategy of buying Exchange Traded Funds at 52 week lows. In fact the only book I could find about 52 week low bargain hunting was The 52-Week Low Formula: A Contrarian Strategy that Lowers Risk, Beats the Market, and Overcomes Human Emotion by Luke L. Wiley. That book was published back in 2014, and it's about buying individual stocks at 52 week lows, not funds.
So how about buying ETFs at 52 week lows.
Does it work?
Yes!
How much backtesting did I do?
I used data from 2021 - 2024 inclusive. Note that because the 52 week period does of course require an entire year's worth of data before there are any results, there are no results for 2021.
I should point out that 2021-24 have seen some incredible bull/bear periods so it's probably a decent enough test period. I'm working on acquiring the data for much longer backtesting.
To conduct the backtesting, I used a custom built C# and SQL Server app. It provides the data for the website you're visiting right now. There's no fancy AI just good old fashioned basic quantitative finance maths. I've double checked my results with TradingView charts.
I don't include dividends in my calculations, so the actual profits would be higher than stated here, particularly for high yield bond and debt funds.
I conducted the backtesting on over 150 of the largest and most popular US listed ETFs - the ones that are featured on this website. There are no inverse, leveraged, super high yielders or other novel stuff. They're primarily just regular blue chip "safe" ETFs and all of the major country specific ETFs and commodities.
Results
- 2022: 890 profitable trades, 109 losses (89% win rate). The worst loss was 53% on the ARKK 3D Printing ETF (PRNT). There were significant (but much smaller) losses on bond/treasury funds. However, with dividends they would generally have broken even by mid-2024. There were also 47 trades that doubled in price. A few of these were the country specific ETFs including Argentina and Poland. One example of a US sector ETF that doubled was the home construction fund (ITB). It hit a 52 week low of $59.17 on 31 March 2022, but by 29 July 2024 it had doubled in price to $120.40. The maximum drawdown was -18.84% while further lows were set. Hodling this ETF would have richly rewarded the hodler.
- 2023: 207 profitable trades, 19 losses (91% win rate). The maximum loss was 48% on the solar energy ETF. A total of 20 trades resulted in eventual 50% profits. Unlike in 2022 there have been no doublers (to the time of writing in October 2024).
- 2024 (up to October): 80 profitable, 10 losses (89% win rate). The maximum loss was 14% on an exotic KPOP) ETF. There was also a modest loss on a loan fund but it pays a monster 8%+ dividend so this trade is actually in profit.
*Profitable is defined as having achieved at least 6% profit.
Filtering Trades to Avoid Losers
Like all trading strategies, buying ETFs at 52 week lows is not a 100% guarantee the trade will be profitable. However, at 80 - 90% win rates it is potentially more profitable than just about any other trading strategy you're likely to encounter. The only trading strategies I know of with similarly high success rates are buying stocks with the double bottom or inverse head and shoulders pattern [these generally have a 70 - 80% win rate].
This strategy seems to work equally in bull and bear markets. In bear markets there are numerous more chances to buy ETFs at 52 week lows. As you can see from the data above, my algorithm made 10x as many trades in 2022 than it managed in January - September of 2024.
At the time of writing this article in late October 2024, almost everything has gone up a lot. And if it's just been going sideways it hasn't been setting new 52 week lows. There hasn't been a decent 52 week low in a couple of months. The last good one was VanEck Oil Services (OIH) on 11 September. It's currently up 6.46% and achieved 10% profit after just 8 days. My algorithm as used on this website would have bought at the absolute bottom.
To avoid the worst of the losses, a good strategy seems to be to avoiding buying ETFs related to new technologies and unproven technologies. Recent examples of this are 3D printing, and I would include AI in this. AI is not yet showing huge losses, but it could easily be the next solar energy or 3D printing.
It's also best to avoid funds in obvious long term downtrends - the most infamous in my test portfolio is the VanEck Rare Earth Metals ETF (REMX). It turns out these metals probably aren't so rare after all. So avoiding charts that look like this could be an important way of staying out of losing trades:
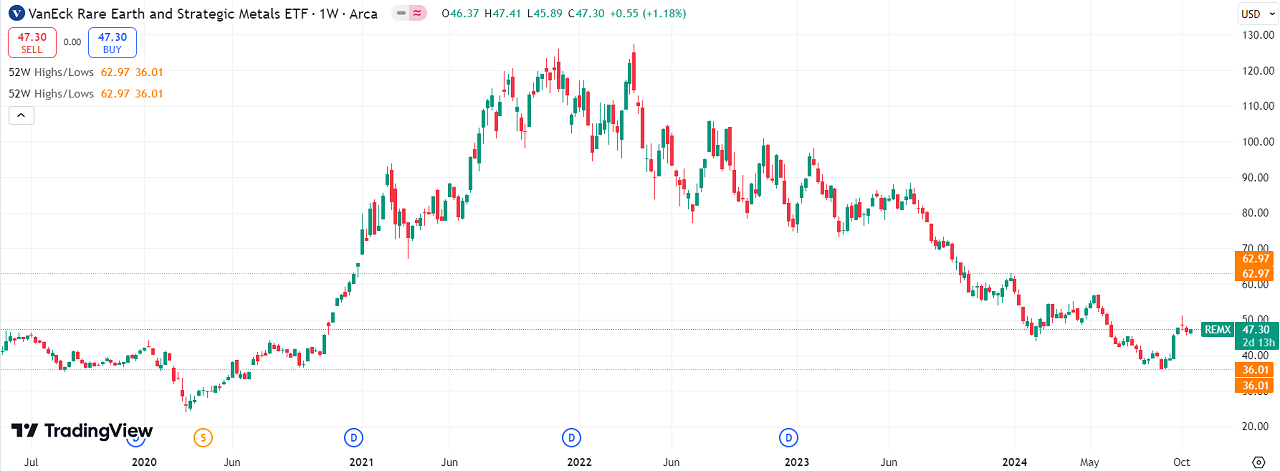
I should just point out that there have been some spectacular short covering rallies in this ETF so not all trades would have been loss making. For example there was a chance to buy at a 52 week low in early February 2024 that would have yielded a 20% profit by May of the same year. Such rallies are increasingly likely as stocks/funds get beaten down to very low levels compared to previous highs.
Finally it appears that it's best to stick to quality markets and funds. Now that I've pretty much added all of the best quality investment sectors to this site, I've had to trawl ETF lists for ones that I haven't really covered. Quality has decreased and the more recent additions to this site's database have actually decreased the probability of trades being profitable. When I only had a core holding of blue chip ETFs on this site 2024's 52 week low strategy had a 100% win rate!
How about doubling down on a particular fund? As can be seen with the Rare Earths, doubling or tripling down on the same ETF (i.e. dollar cost averaging) does seem to work and is much safer with a well diversified ETF than it is with an individual stock.
The number of times my test script bought the absolute bottom was surprising. As I mentioned above, 11 September's (OIH) purchase was just one of many examples. It's probable that hedge fund algos are using the same strategy, but it's not widely known by private investors (who usually like to buy at 52 Week Highs!)
This strategy may or may not work with individual stocks. I recommend checking out the Luke L. Wiley book if you're interested in buying stocks at 52 week lows. It's unlikely to work with high risk pharma or tech stocks. But it does seem to work with blue chips that are going through a rough time. At the time of writing Rentokil Initial (RTO) is one of the best examples of a 52 week low stock that will probably recover strongly. All it will take is one single good earnings report or analyst upgrade. Buying the Anglo-Dutch blue chip Unilever when it hit a 52 week low in January 2024 would have been an incredibly good trade. At the time of writing it soared 37% over the Summer (plus there's a decent dividend too).
Of course I'm assuming you can actually buy at the 52 week low price. However if you look at the charts then they tend not to shoot up as soon as the 52 week low is hit. There are also quite often second or third chances to buy at around the same level, or a lower low. Unilever is a great example of this. There were a total of 6 trading days where the price hovvered around the 52 week low price. It also had a significant pullback when the price came to within 1.6% of the previous low. The stock then completed a double bottom - a bullish signal with a very high success rate.
I hope you find my findings interesting. Another similar strategy is to buy the ETF Dogs - i.e. the worst performing funds in the previous 12 months, so be sure to check that out too.
Remember this article and website are not investing advice and are for entertainment purposes only.